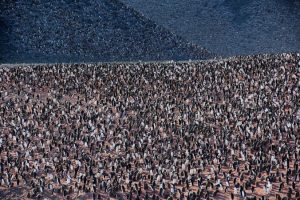
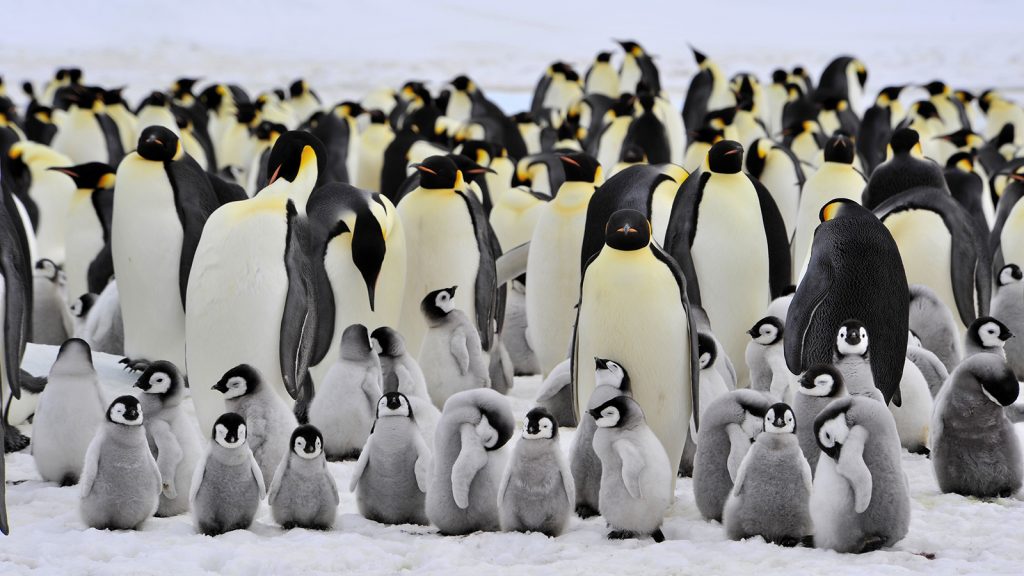
Off the coast of western Antarctica, a tiny archipelago called the Danger Islands has been home to more than 1.5 million Adélie penguins that were hiding in plain sight.
The islands were long known to have penguins, but how many remained a mystery until satellite images and an on-the-ground survey revealed the colonies’ immense sizes.
The new counts include the third and fourth largest colonies of Adélie penguins in the world; in all, they increase the region’s known penguin abundance by nearly 70 percent.
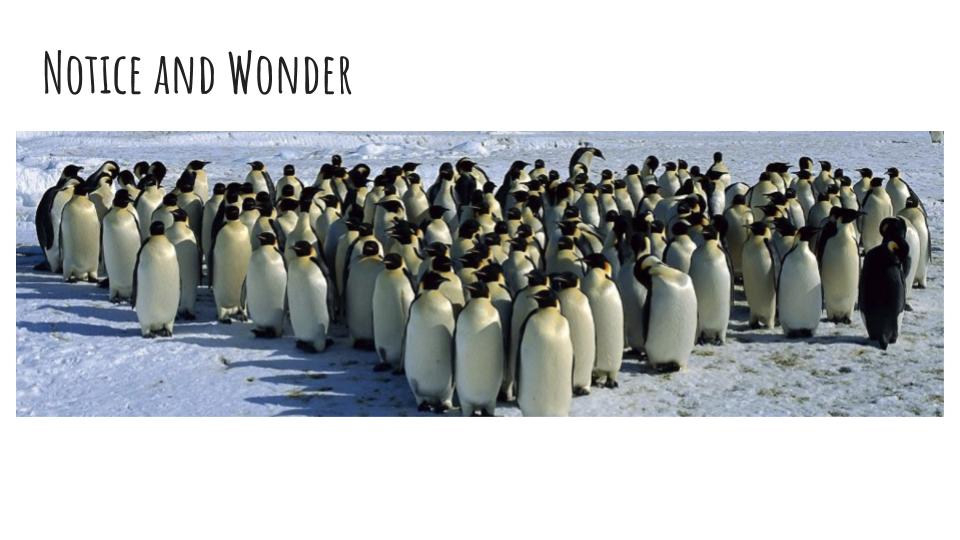
These penguin look like they are making a triangular formation! How many penguins in this formation? What patterns do you see in triangular numbers?
https://kids.nationalgeographic.com/videos?videoGuid=e5251129-090b-457c-8645-3537b5a50987
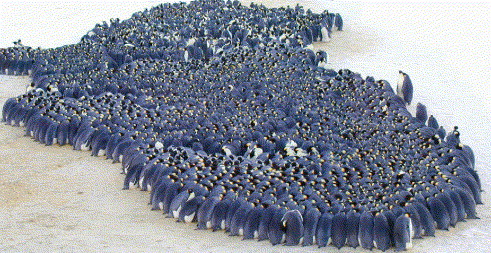
Wonder: How do penguins keep themselves warm in Antartica?
Observe and research: They move in their huddle to take turns being on the inside the huddle.
Notice and Gather Information: How many are in the huddle below?
Do the Math:
from http://www.learner.org/courses/learningmath/data/session9/part_b/index.html
Statisticians often use a random sample to estimate characteristics of a population when the population is very large and they cannot obtain data on every individual in the population. Statistical estimation asks the fundamental questions “What can I say about a whole population based on information from a random sample of that population?” and “To what degree can I say that my estimate is accurate?” Let’s put random sampling into action to answer a question about demographics: “How many penguins are there on a particular ice floe in the Antarctic?”

Counting a penguin population can be tricky. Penguins tend to move around and swim off, and it’s cold! So scientists use aerial photographs and statistical sampling to estimate population size. Some of the techniques they use are quite sophisticated, but we can look at a simplified version of their approach to examine the basic ideas of random sampling and estimation.
Imagine a large, snow-covered, square region of the Antarctic that is inhabited by penguins. From above, it would look like a white square sprinkled with black dots:

If you had access to such an aerial view, you could count the dots to determine the number of penguins in this region. But suppose the region was too large to see in one photo. You might instead take 100 photographs of the 100 smaller square sub-regions, count the penguins in each sub-region, and total these to obtain a count for the entire region. However, this might take too long and be too expensive. So here’s another alternative: You can select a representative sample of the sub-regions, obtain photos of only these, and use the counts from these sub-regions to estimate the total number of penguins in the entire region
Explain & Evaluate: In making estimates by sampling, there is a balancing act in selecting the sample size. A larger sample size may cost more money or be more difficult to generate, but it should provide a more accurate estimate of the population characteristic you are studying. On the other hand, a sample size that is too small may not be accurate enough for you to be certain of your results.
Revise and Report: You may have noticed that your estimates for the total penguin population vary quite a bit based on both the sample size and which sub-regions were sampled. The decision about how to select a sample, accordingly, is a critical one in statistics. It is important that each part of the population be treated fairly. If you are fair in the selection, then you should obtain a representative sample and thus a more fair estimation procedure.
Wonder and learn more!
https://www.wwf.org.uk/wildlife/adelie-penguins
https://www.nature.com/articles/s41598-018-22313-w/figures/3
http://www.learner.org/courses/learningmath/data/session9/part_b/index.html


